
Why HYPE ETFs are outperforming BTC, ETH, and SOL ETFs
HYPE ETF inflows look strong in absolute terms, but the real signal appears when net inflows are compared with market cap across BTC, ETH, SOL, and HYPE
ETF flows are usually ranked by dollars. That is useful, but incomplete.
A $1.0B inflow into BTC and a $100.0M inflow into HYPE do not mean the same thing. The first is flowing into the largest crypto asset in the world. The second is flowing into a much smaller market.
The better question is not just how much capital entered the product. The better question is how meaningful that capital was relative to the size of the underlying asset. That is where HYPE starts to look different.
Using the first seven trading days of BTC, ETH, SOL, and HYPE ETF products, we compared cumulative net inflows with each asset’s market cap. The result is clear: on a market-cap-adjusted basis, HYPE is currently outperforming the other crypto ETF launches by a wide margin.
Absolute flows miss the point
In absolute terms, BTC still had the largest launch.
Across the first seven trading days in this comparison, BTC ETF products saw roughly $1.09B in net inflows. SOL followed with $293.9M. HYPE came in at $113.1M. ETH was negative, with -$484.2M in net flows.
At first glance, that looks like a simple ranking:
- BTC first
- SOL second
- HYPE third
- ETH last
But that ranking only measures size of flows. It does not measure intensity of demand.
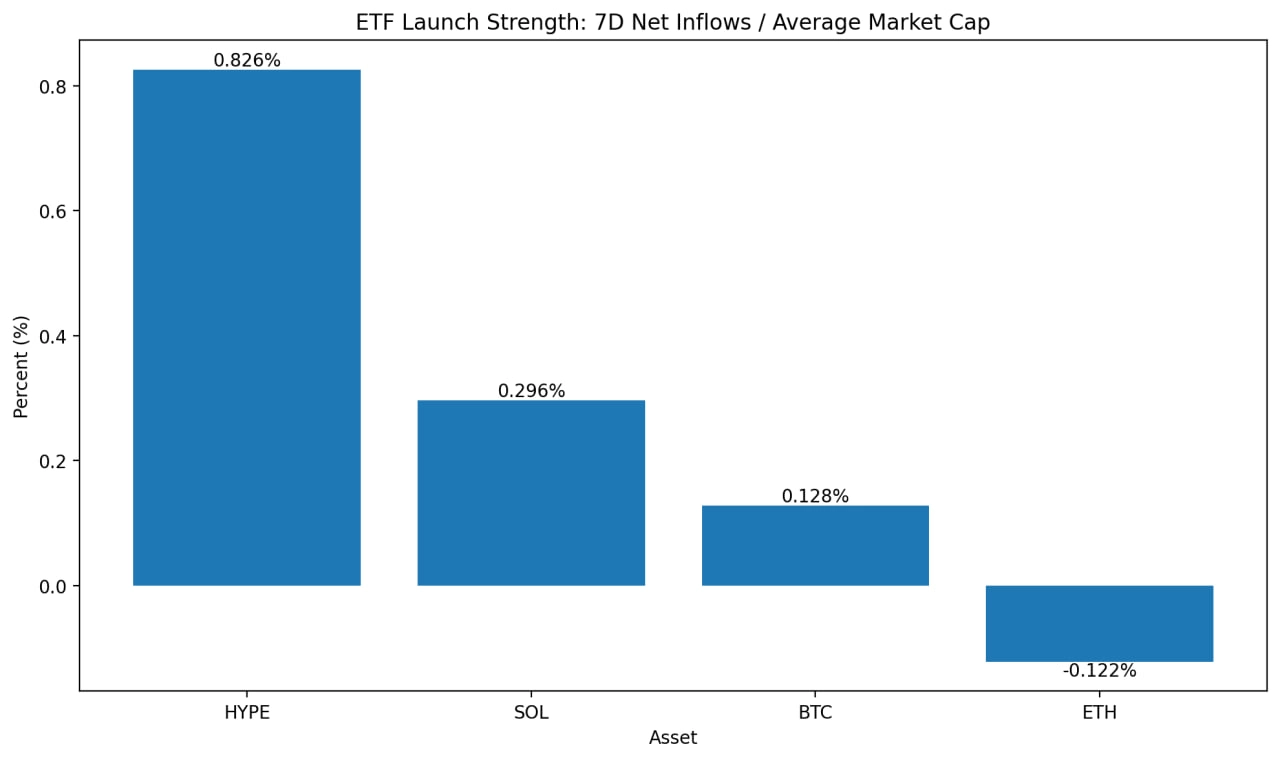
Once we divide those flows by average market cap during the same seven-day window, the ranking changes completely:
Asset | 7d net inflows | Avg market cap | Net inflows / avg market cap |
|---|---|---|---|
HYPE | $113.1M | $13.68B | 0.83% |
SOL | $293.9M | $99.14B | 0.30% |
BTC | $1.09B | $849.43B | 0.13% |
ETH | -$484.2M | $396.71B | -0.12% |
On this basis, HYPE’s first seven trading days were roughly 2.8x stronger than SOL’s and 6.5x stronger than BTC’s.
Market cap adjusted flows show demand intensity
Large assets need much larger flows to move the needle.
BTC can absorb hundreds of millions of dollars in ETF demand without that demand representing a large share of its total market cap. That is one reason absolute ETF flows can be misleading when comparing assets across very different sizes.
HYPE is different.
Because HYPE’s market cap is smaller, even a lower absolute flow number can represent a much larger share of the underlying asset. In this data set, $113.1M of net inflows represented 0.83% of HYPE’s average market cap during the first seven trading days.
That does not mean HYPE had the biggest launch in dollar terms, it means HYPE had the strongest launch in relative terms.
The daily curve is even more important
The cumulative chart tells the stronger story. HYPE did not lead from day one. In the early sessions, BTC and SOL were ahead on a market-cap-adjusted basis. That makes sense. The HYPE product set was still ramping, and early flows were concentrated in a small number of issuers.
After day 5, HYPE began to accelerate sharply.
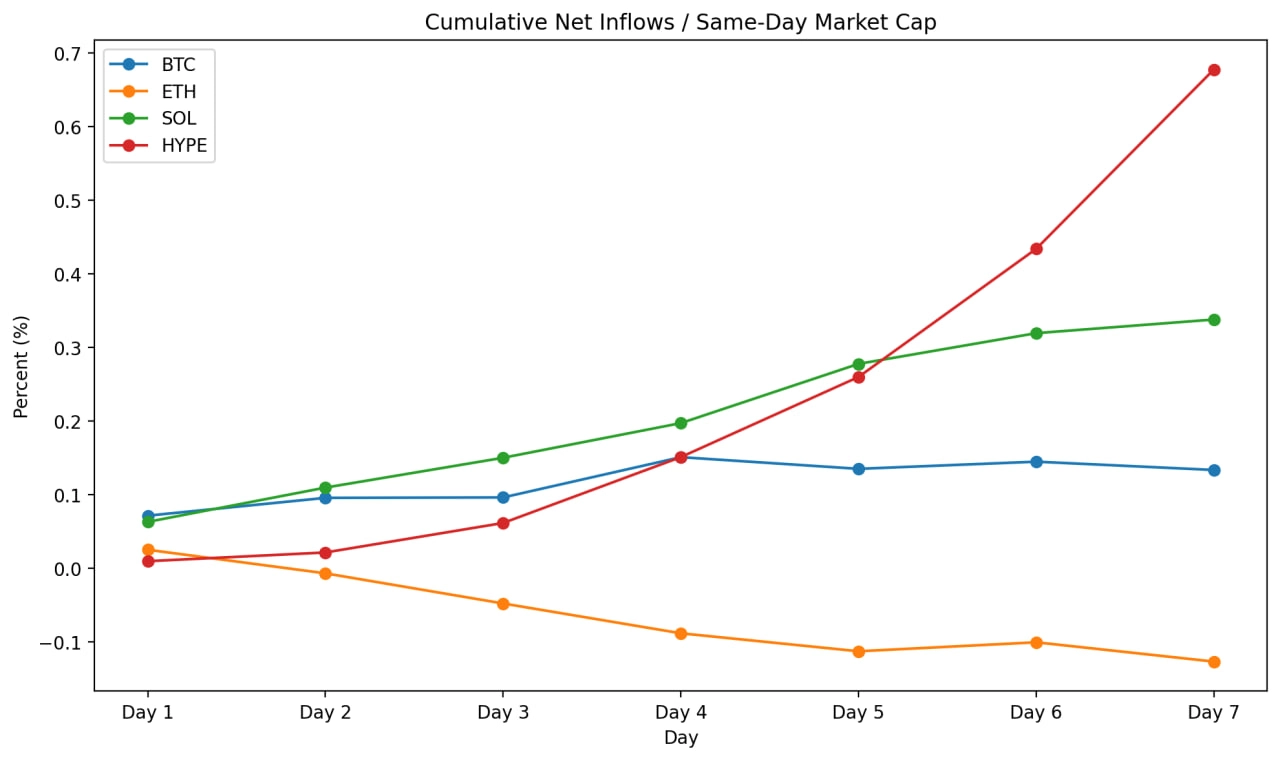
By day 7, HYPE had broken away from the rest of the group. SOL continued to climb steadily. BTC stayed positive but relatively flat. ETH remained negative.
That acceleration matters because the HYPE ETF market was not fully built from day one.
21Shares announced the launch of THYP on May 12, 2026, while Bitwise announced BHYP on May 14, 2026, with trading expected to begin on May 15, 2026. That means Bitwise was not part of the product set from the start of the HYPE window.
So the HYPE numbers are not coming from a mature ETF lineup yet, they are coming from an early market that is still adding distribution.
The Grayscale caveat
There is one important caveat on the other side of the comparison: BTC and ETH had a unique Grayscale overhang.
GBTC and ETHE were not clean new launches in the same way as many other products in their respective categories. They were large existing trusts that converted into ETF structures. That created an early wave of outflows as holders exited or rotated into lower-fee products after conversion.
Farside data shows large GBTC outflows during the first trading days of the BTC ETF launch, including -$95.1M on day one, -$484.1M on day two, and -$594.4M on the fourth listed trading day in the data set. ETH had a similar issue: ETHE saw nearly $500.0M of outflows on its first trading day, and more than $1.1B of outflows over its first three trading days, according to ETF.com’s reporting based on Farside data.
BTC and ETH aggregate flows were weighed down by legacy trust exits. HYPE and SOL did not have the same type of embedded Grayscale conversion pressure in this data set, but even with that caveat, the result is still notable.
Why this matters
ETF launches are often treated as distribution events, but they are also market structure events. They create regulated access, unlock new pools of capital, and change how traditional investors can express demand for an asset.
For large assets, that demand can be meaningful but diluted by the size of the existing market.
For smaller assets, the same type of demand can be far more concentrated.
That is why market-cap-adjusted flows are a better lens for comparing early ETF performance across BTC, ETH, SOL, and HYPE. They show not just how much money came in, but how much pressure that capital represents relative to the asset itself.
By that measure, HYPE is currently the standout.
Follow the market where it happens
ETF flows are only one part of the story.
The other part is how traders react in real time.
Markets gives you a front row seat to that layer: live positions, trader activity, market moves, and the wallets worth watching across Hyperliquid.
Use Markets on web, or download the mobile app on iOS or Android:
- Web: markets.xyz
- Mobile app: markets.xyz/mobile-app
All Markets. All Hours. All Onchain.

